Overseer

Self-hosted · open source · no account

The whole ops team, when the ops team is you.

It inventories, watches, files incidents for, investigates, patches and pages you about what you run — and tells you plainly which parts it cannot see, because a dashboard that is green by default is worse than no dashboard.

Try the incident walkthrough ↓ See the agents → Ten minutes, one machine, no sign-up.
3,467
unit tests
311
browser tests
20
connectors
AGPL-3.0
open source
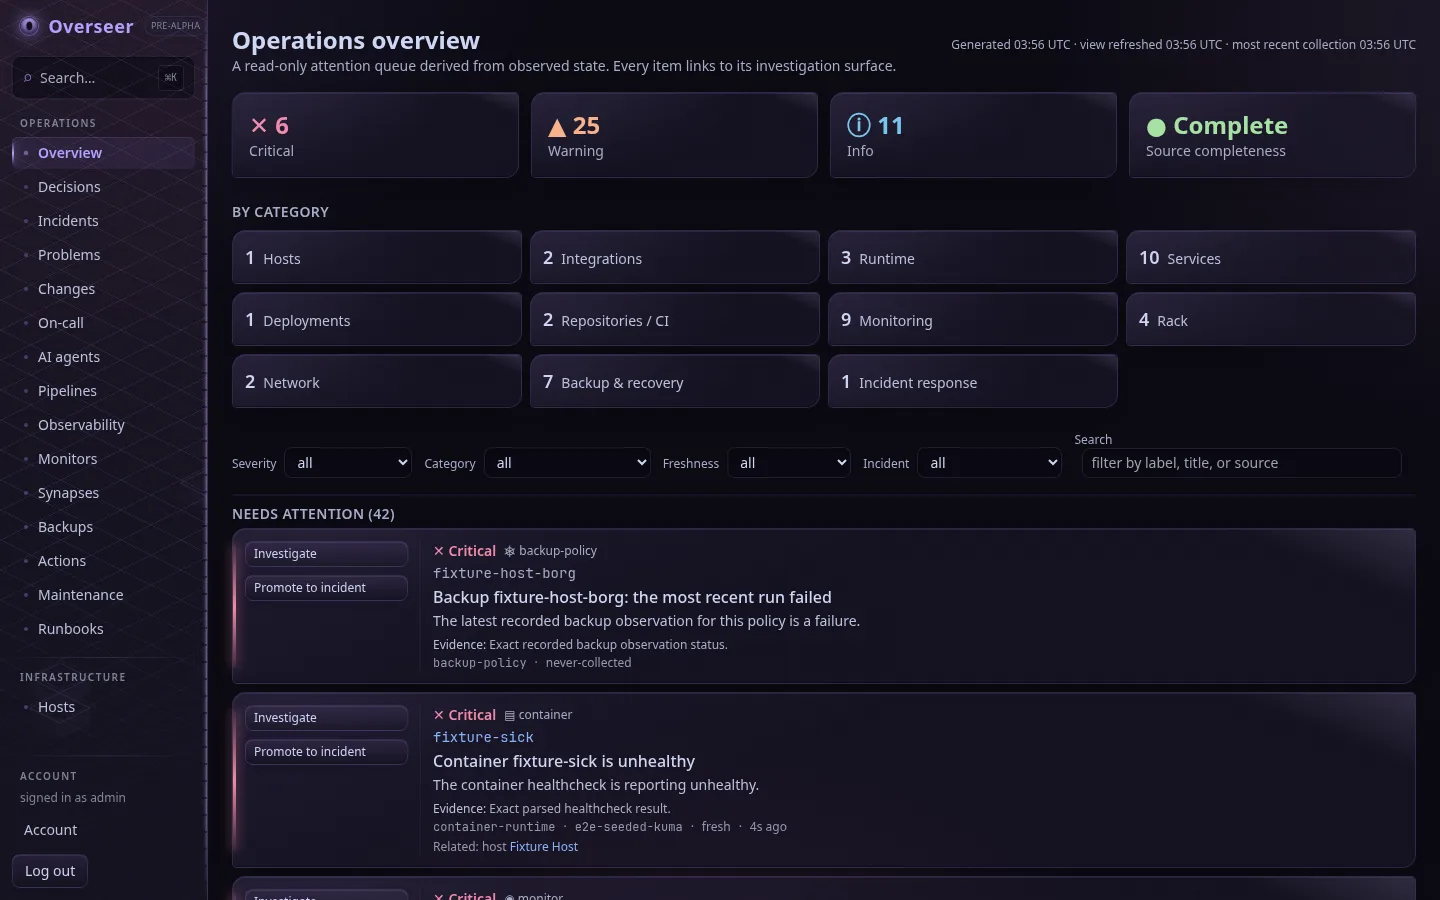
The Overseer operations overview, showing a severity-ranked attention queue with evidence on each item.
The attention queue: every item derived from something observed, carrying the evidence it came from. Screenshots on this page are the project’s own test fixture, not a real estate.
Why it is different

Built to be believed

Every tool in this space has an inventory and a dashboard. The difference is what happens when the tool does not know something — and these rules are enforced by the test suite, not by good intentions.

01

Missing data is never healthy data

A check nothing has observed reads unknown, not up. An agent that stopped reporting reads stale, not fine. A failed collection keeps what it knew and marks it stale rather than quietly erasing it.

Most dashboards are green partly because they cannot tell the difference.

02

It refuses rather than guesses

An ambiguous match is reported as ambiguous. An endpoint it cannot parse yields nothing instead of a plausible-looking wrong answer.

Fewer confident statements, more true ones.

03

Read-only until you say otherwise

Every write surface is off by default and named. Nothing is auto-applied. There is no arbitrary command endpoint and no remote shell.

There is no PUT or DELETE anywhere in the API, and a test asserts it.

04

Your data stays yours

Self-hosted, single tenant, SQLite on your disk. No telemetry, no phone-home, no account, no licence check.

It binds to localhost until you deliberately put it behind something.

What it does

One operational picture, not four tools and a spreadsheet

Three surfaces worth seeing at full size. A 1440px console shrunk into a column proves nothing, so these are shown whole.

Relationships

Follow the exact chain, not a guess

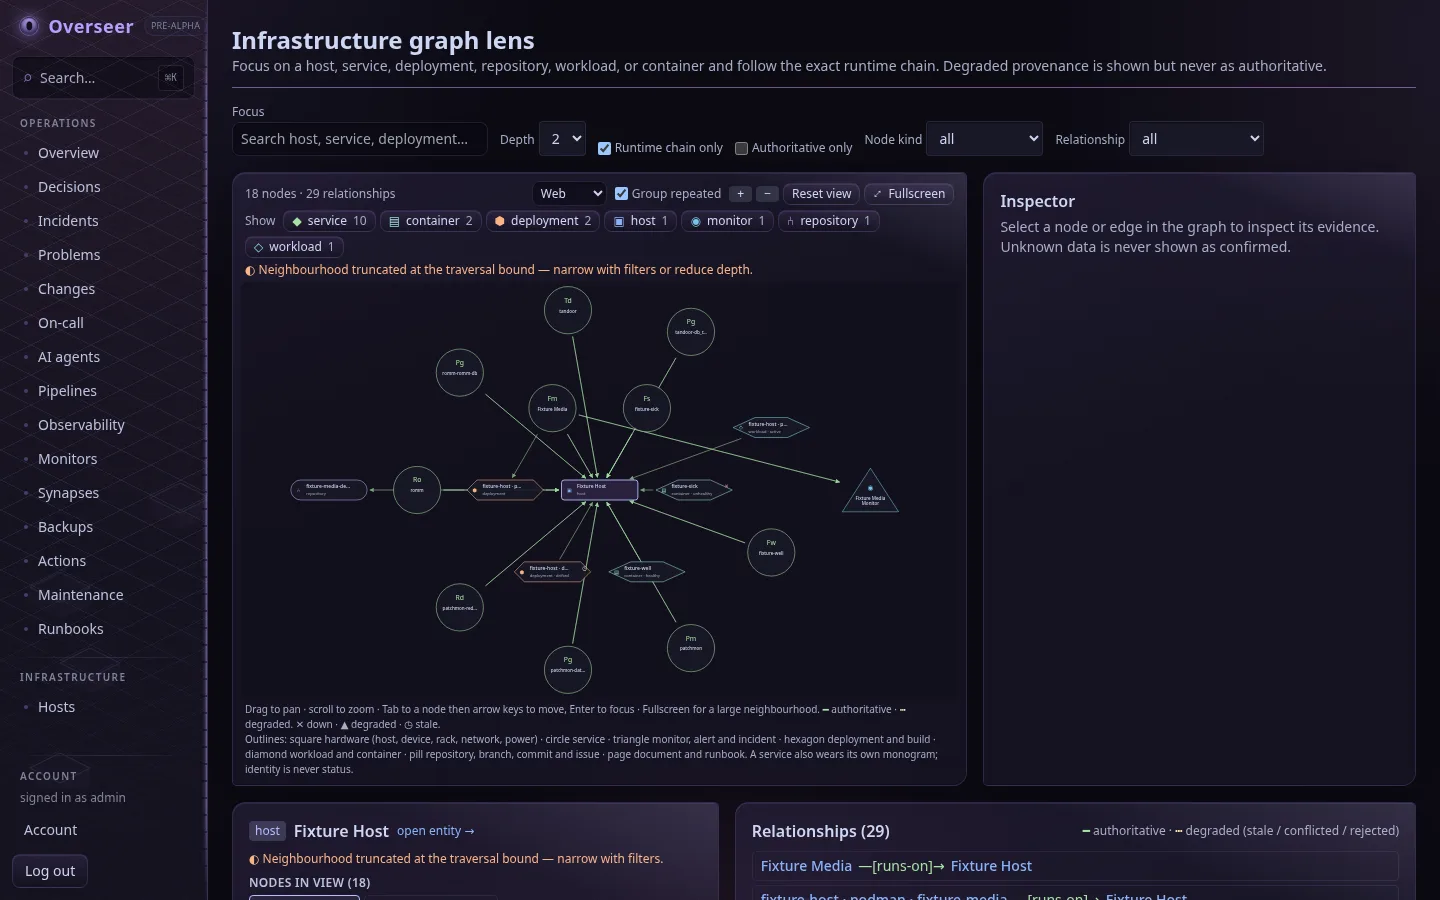
Hosts, services, containers, deployments and repositories, connected only where a real relationship was recorded. Degraded provenance is shown and labelled, never quietly promoted to fact.

The infrastructure graph lens showing nodes and labelled relationships with an inspector panel.
Graph lens — bounded traversal with an inspector that never shows unknown data as confirmed.
Monitoring

Checks you own, on agents you install

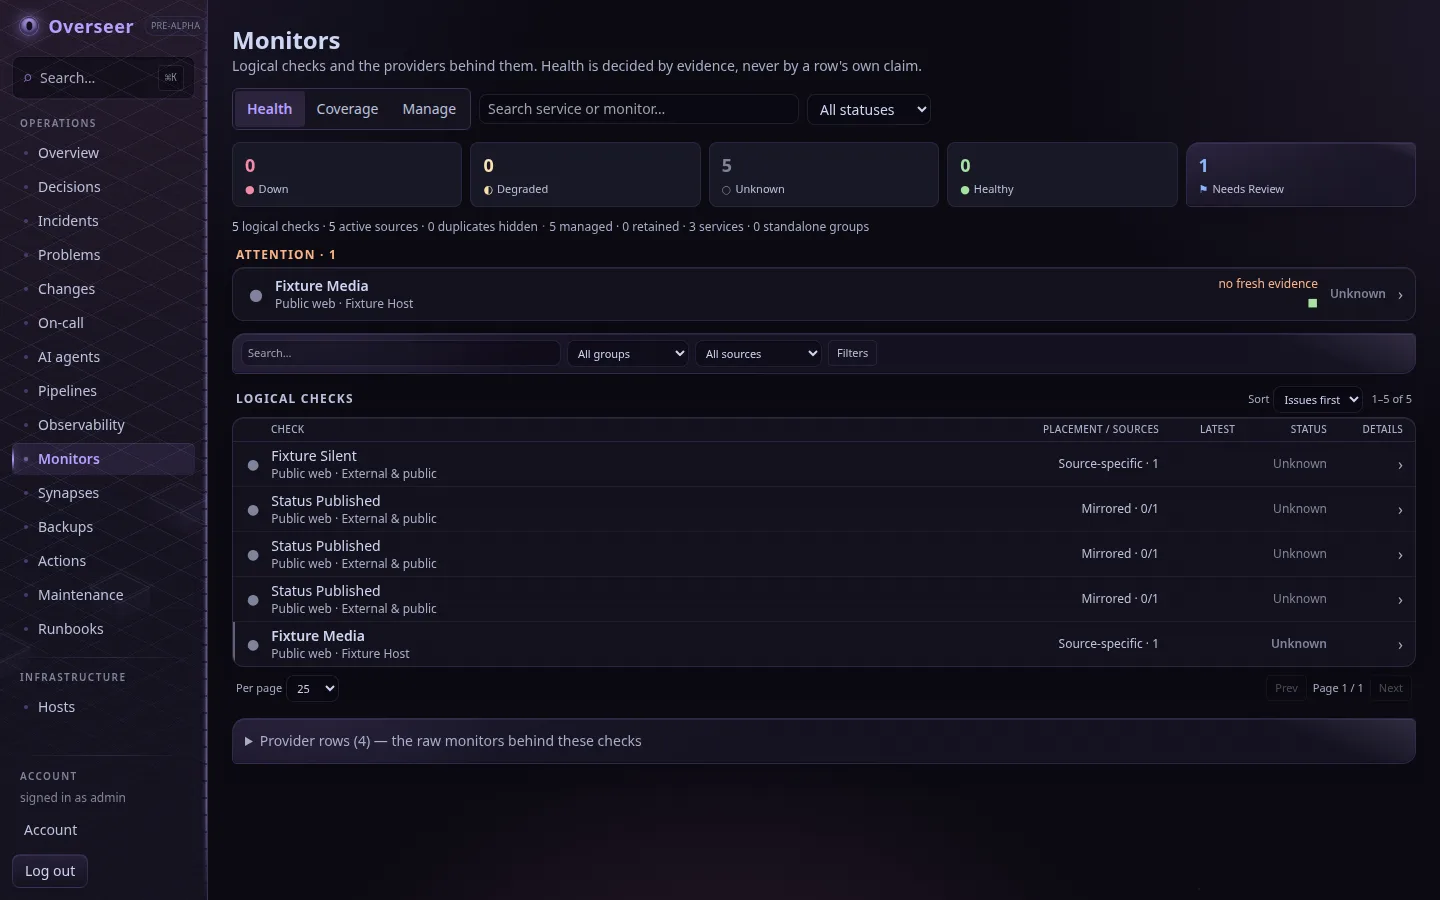
One command installs a probe agent on any Linux box. It checks HTTPS, TCP, ICMP and DNS, reports back, and holds no state of its own — nothing to expose, no inbound port, no separate monitoring server to babysit.

The monitors command centre showing uptime bars, latency and per-check coverage.
Monitors — coverage, uptime and latency, with unlinked checks called out rather than hidden.
Recovery

Backups you can actually verify

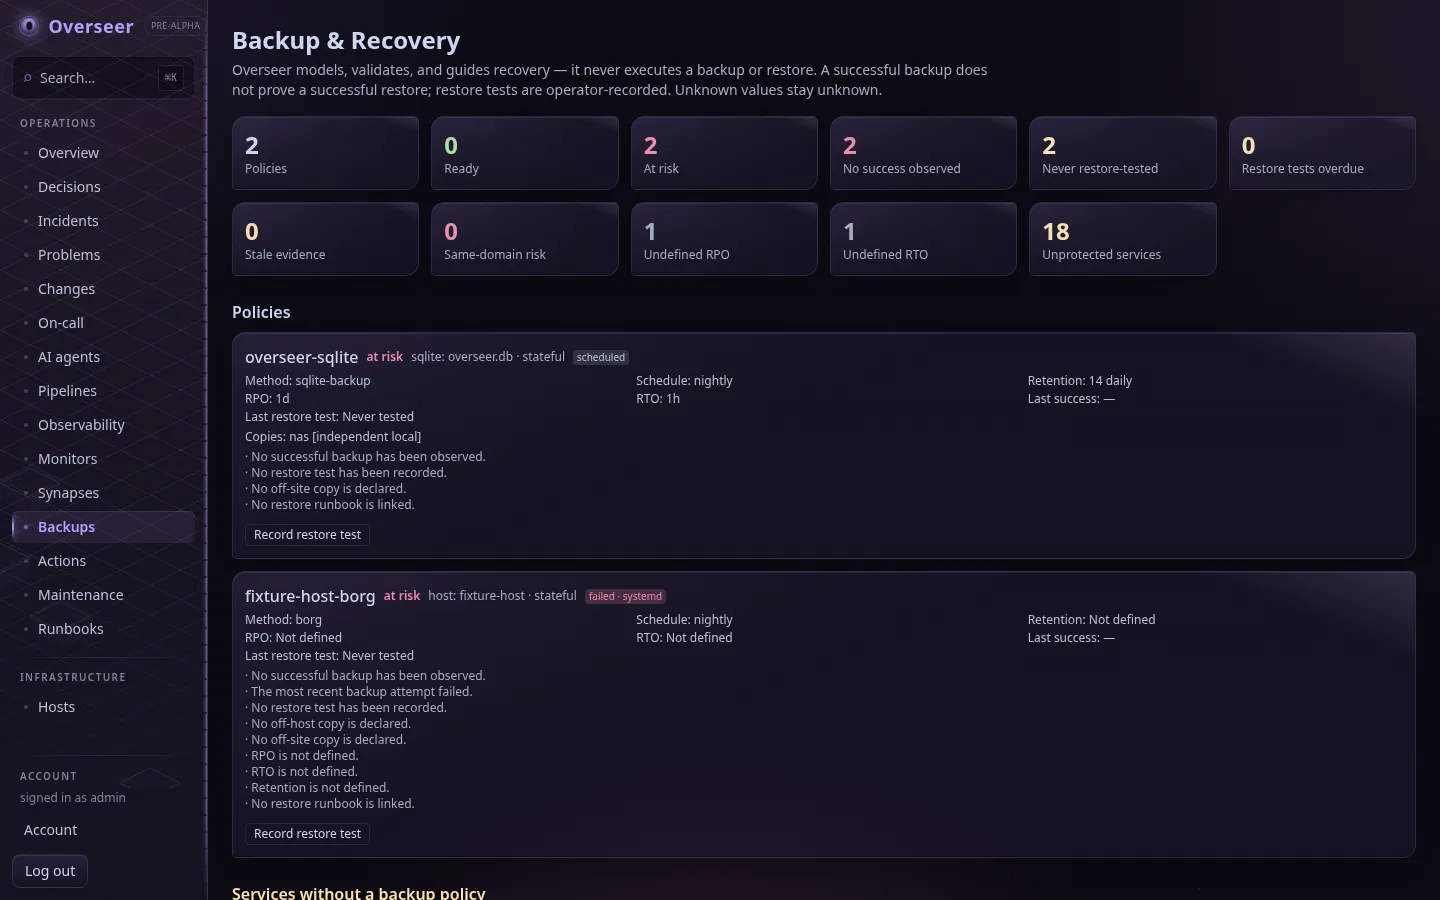
Model your policies and copies, record restore tests, and get a readiness answer derived from evidence. Overseer never runs your backups — it tells you whether the ones you run would get you back.

The backups dashboard showing policies, copies, evidence states and recovery readiness.
Backups — readiness derived from recorded evidence, with unknown states shown as unknown.
When something breaks

An incident process that survives the incident

Overseer follows ITIL where ITIL is right and stops where it turns into paperwork. Eight things it does that a severity dropdown cannot.

01

Two axes, not one severity dropdown

Impact is how much is affected; urgency is how fast it has to be fixed. They are genuinely independent — a marketing page down for everyone is high impact and low urgency, a payroll run due Friday is the reverse — and collapsing them into one number makes those two incidents look identical.

02

Priority is derived, explained, and yours to change

Priority comes from the pair by a matrix you edit in the interface, and every derivation names the evidence it used. An operator override always wins and is recorded beside the derived value.

03

A clock, or an honest absence of one

Response and resolution targets are yours to declare. Where the timestamp a measure needs is missing, it reads unmeasurable — never a green “within target” inferred from data that was never recorded.

04

Closing one leaves something behind

Resolving needs a category and a closure code from closed lists, so “what keeps breaking” has an answer instead of a folder of free text. Four of those codes mean the symptom is gone and the fault is not, and the page says so.

05

Declaring a major incident is a decision, not a number

A P1 comes out of the matrix. Declaring is somebody judging the ordinary response is not enough, and it is recorded as the act it is, with a reason.

06

It blames the path, not the service, when it can prove it

A service failing from outside while its container is demonstrably alive is not a dead service — it is a dead route to a working one. The incident opens saying so. Your services stay innocent of your ISP’s crimes.

07

A flapping fault is one record, not forty

Once the same subject has produced three incidents in a day, the next episode continues the same incident instead of filing a fresh one — its timeline becomes the flap log.

08

The fault outlives the incident

An incident closed on a workaround is finished; the fault is not. A problem record survives it and refuses to be called resolved without a permanent fix.

During

A comms path, and a clock you cannot quietly miss

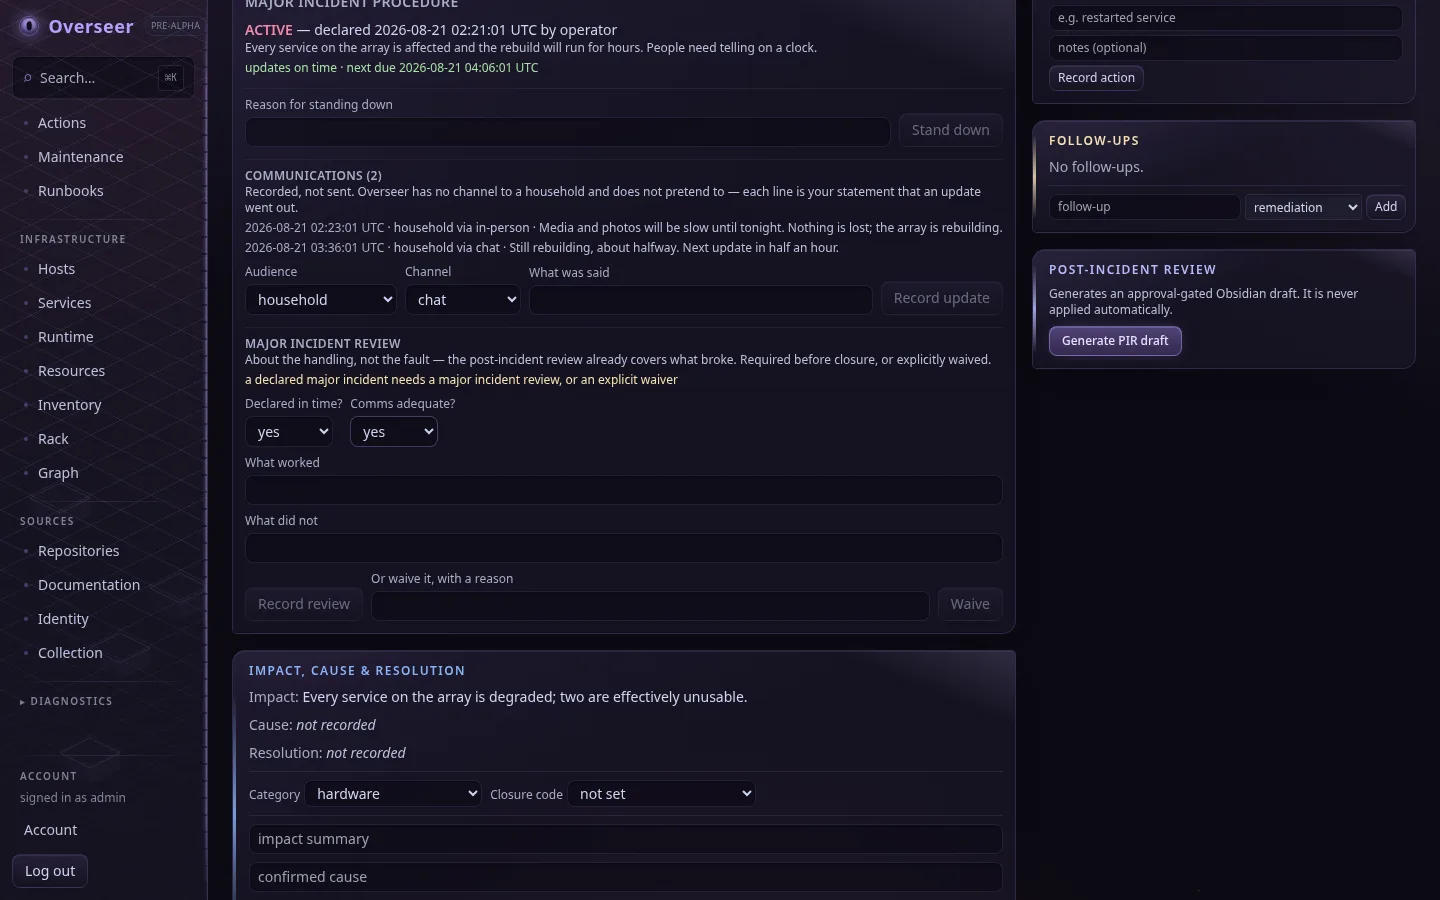
Declare, and Overseer starts expecting updates on the cadence you named. Updates are recorded rather than sent — it has no channel to your customers and does not pretend to — and an operator who declared no cadence reads “no cadence”, not “on time”.

An incident workspace showing a P3 priority directly above an active major incident declaration, recorded communications and the review that gates closure.
A P3, and a major incident — the priority is derived, the declaration is a decision, and they do not have to agree.
Afterwards

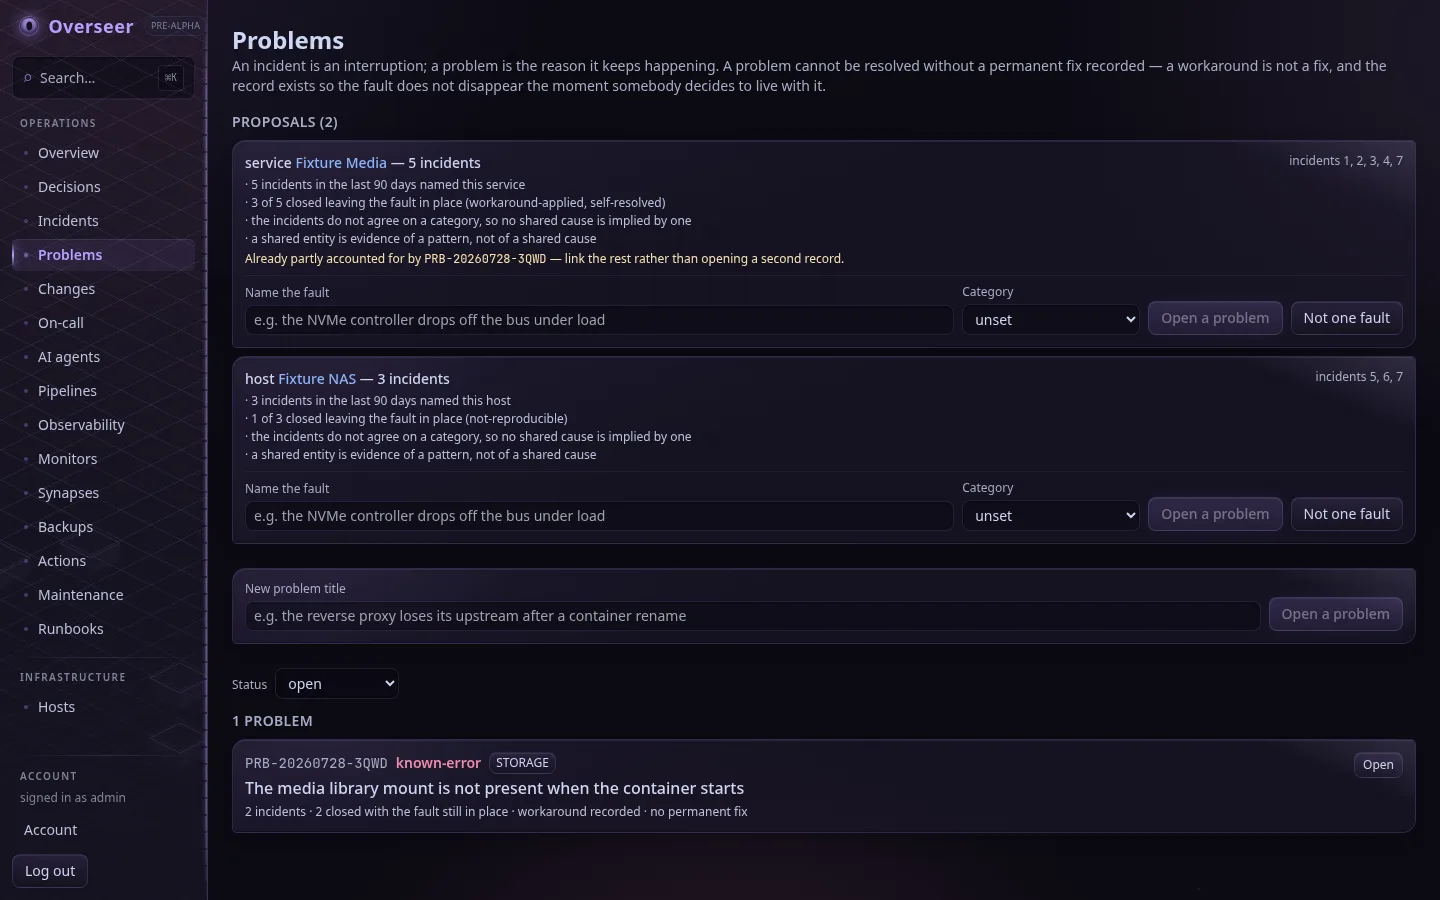
What keeps happening, proposed and never concluded

Overseer notices when incidents keep naming the same thing and proposes a problem. It never asserts one: a host that has had a full disk, a bad cable and an OOM kill has had three problems, not one, so every proposal shows its reasons and says outright that a shared entity is a pattern and not a shared cause. You name the fault; it records who did and why.

The problems page showing two proposals with their reasons and one known error with a workaround but no permanent fix.
Problems — proposals with their evidence, and a known error that cannot be called resolved.
Over time

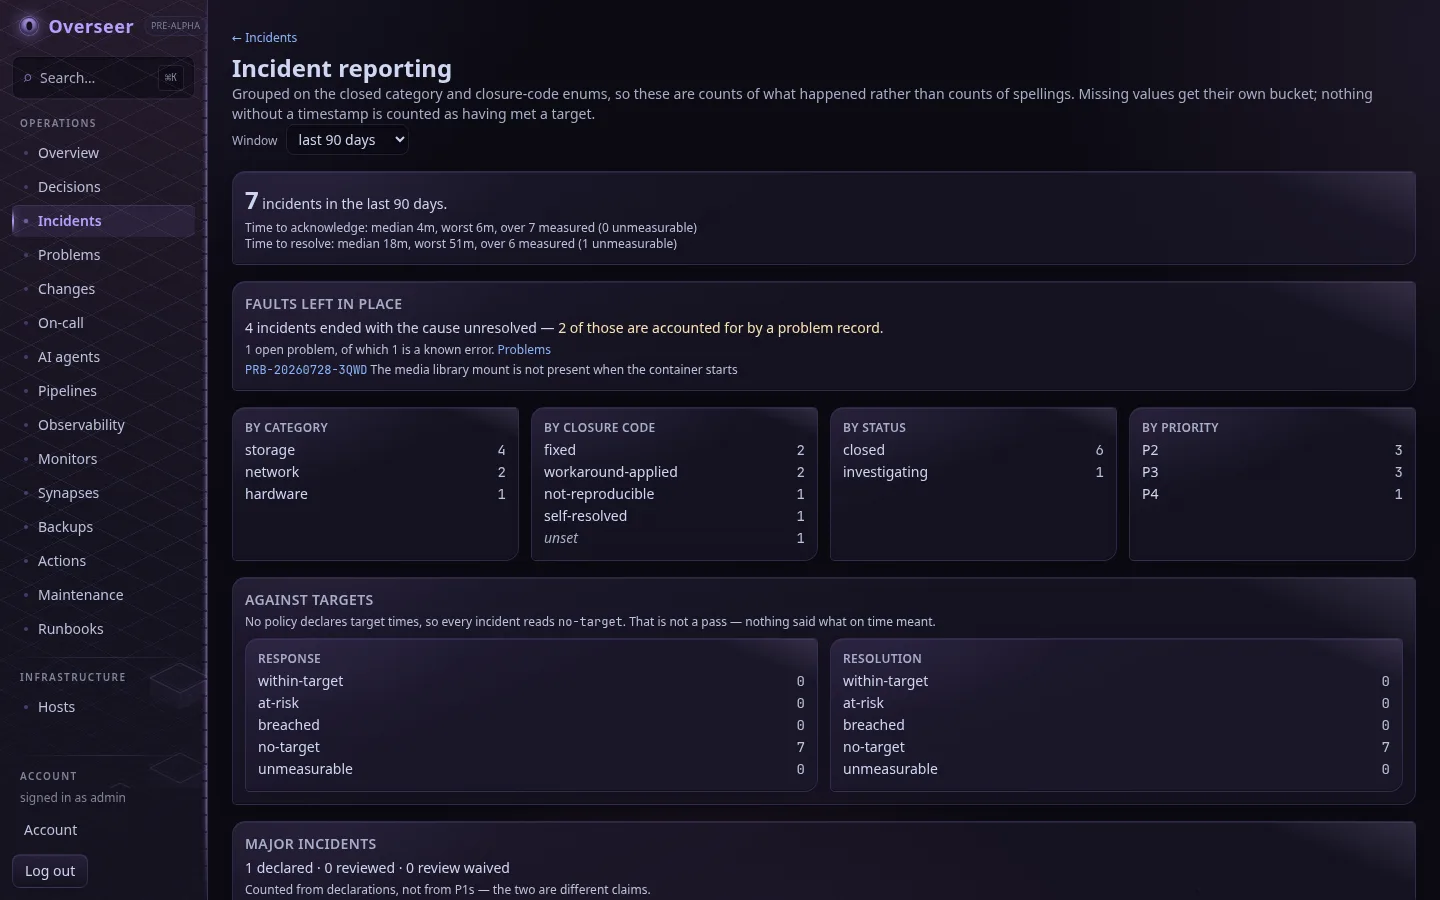
Counts of what happened, not counts of spellings

Categories and closure codes are closed lists, so the report groups on something stable. Every distribution carries the bucket for what nobody filled in, and the headline is how many incidents ended with the fault still in place.

The incident reporting page showing distributions by category and closure code, target states, and the faults-left-in-place figure.
Reporting — with no targets declared everything reads no-target, which the page states rather than scoring as a pass.
Interactive walkthrough

Take one incident from detection to a decision.

A sample-data recreation of the incident workspace. The record, the evidence and the agent’s findings are fictional; the state machine is the real one. Accept or reject the proposal, or let the condition clear on its own, and watch what the record does. Nothing here reaches a real estate — the page makes no network request at all.

A look at it

Fourteen surfaces, in the space of one

Every screenshot here is the project’s own end-to-end test fixture, not somebody’s estate. Page through them.

The overview page showing the attention queue grouped by severity with evidence for each item.
1 / 14
The attention queue — every item carries the evidence it was derived from, and unknown states stay unknown.
After it opens

A finding that reaches nobody is not a finding

Detecting an outage is the easy half. Everything below runs unattended, without anybody watching a screen.

01

It opens without being asked

A condition that holds for five minutes becomes an incident, ranked at the moment it opens rather than when somebody first looks at it, and dated from the first observation.

02

It reaches you where you already are

The attention queue is the only transport, so nothing can be notified that is not also on the board. Open incidents go to chat at a severity that matches their rank, carrying an Acknowledge button and a link to the record.

03

The thread is the whole story

Each incident becomes its own post, and everything that happens to it lands inside: status changes, the condition returning, the investigating agent’s conclusion, and the resolution with its closure code.

04

It closes itself honestly

A condition that clears and stays clear resolves the incident and backdates it to the recovery, with the closure code “self-resolved” — because the symptom stopping is not the same as somebody fixing it.

From your pocket

Read it, decide it, fix it — without opening a laptop

Detection, attribution and investigation run unattended. What remains is the decision, and the decision comes to you: a button on the message that told you, gated twice, and honest about its limits.

01

Acknowledge from the message that woke you

The incident’s opening post carries an Acknowledge button. Pressing it records the acknowledgement under your name and quietens the paging — one tap, back to sleep.

02

Decide a proposal beside the reasoning

When an agent’s investigation queues a proposal, Accept and Reject appear on the very post that states its conclusion. The decision is still one deliberate human click; the click just happens where you read.

03

Fix it in two taps, with the plan in between

When exactly one predeclared action fits — restart this container — its button appears on the post. The first tap answers with precisely what would run; the second executes it; the verification lands back in the thread.

04

Two locks on every press

A user-id allowlist decides WHO may act from chat, checked against the id the platform supplies. Your own grants decide WHAT that press may do. Chat adds reach, never permission.

05

The bot watches Overseer back

The same bot polls Overseer every thirty seconds from outside it. If Overseer stops answering, the bot says so — including the honest sentence that nothing is watching the estate while that is true.

Patching

It applies updates — inside windows you approved, measured by evidence

The gap between a fix existing and a fix applied is the exposure. Overseer reads what is pending on every host, lets you consent to a window, runs it under cover, and believes only the patch monitor about what changed.

01

Posture first, from evidence

Pending and security updates per host, the reboot that is waiting, and how old that evidence is — read from a patch monitor, never inferred from uptime or inventory. A host nobody has reported on says so instead of showing zeros.

02

A window is a consent, not a cron

You plan a host, a scope (security-only or everything), a time box and a reason; approving it is a second, separate signature. A window nobody approved expires. A start the server slept through past its end expires too — applying updates at the wrong time is worse than not applying them.

03

Nightly, and security first

One click per host schedules security updates every night. The schedule is the standing consent: each night mints an approved window, and a host nobody allowlisted, or nobody has evidence for, is skipped with a reason rather than failed at 03:30.

04

It runs under cover, and it is tracked

Firing opens a maintenance cover so the churn is downgraded rather than paged, and an incident that follows the run start to finish — resolved with the before-and-after counts, or left open for a human when it failed.

05

The verdict is the patch monitor’s, not the exit code’s

A run completes only when evidence collected after it shows the counts fall. The first live run proved why: the command exited 0, the agent had not re-reported, and the honest answer at that moment was “unknown”.

06

Nothing crosses the wire but a scope

The host end is a forced-command wrapper that maps “security” or “full” to one fixed command. No package name, no path, no shell ever leaves Overseer — and a transport refusal never counts as a change.

The hard part

A check that cannot fail is worse than no check

A check pointed at a reverse proxy, an auth gate, or a port nothing listens on reports coverage while watching nothing. It is not a weak signal — it is the absence of one wearing a signal’s clothes.

01

A check that never passes is reported

A check that has never once succeeded is not monitoring anything — it reads red forever, so a real outage looks exactly like its normal state. Overseer reports the check rather than leaving the service looking covered.

02

A source that is switched off stops counting

Disabling an integration is a statement that it is gone. Nothing derived from it appears in the queue or the impact graph, so a decommissioned monitoring plane cannot go on feeding stale evidence to a diagnosis.

03

A green check with nothing behind it cannot veto an incident

A check pointed at the wrong port stays green forever. When fresh inventory shows nothing running behind a passing check, that check is struck from the evidence before it can spend itself.

04

Silence is separated from failure

A probe agent that stops reporting is a loss of sight, not a loss of service, and is reported as such. If every agent goes quiet the estate says so plainly.

05

A pulled drive is not a dying one

A disk that leaves the machine keeps arriving from the SMART collector with its last failed result. Overseer asks the host’s own inventory whether the drive is still attached before it calls anything critical.

06

Its own faults are named as its own

A collection that dies inside Overseer — its database busy during a deploy — is filed against Overseer, not against the tool that was never reached.

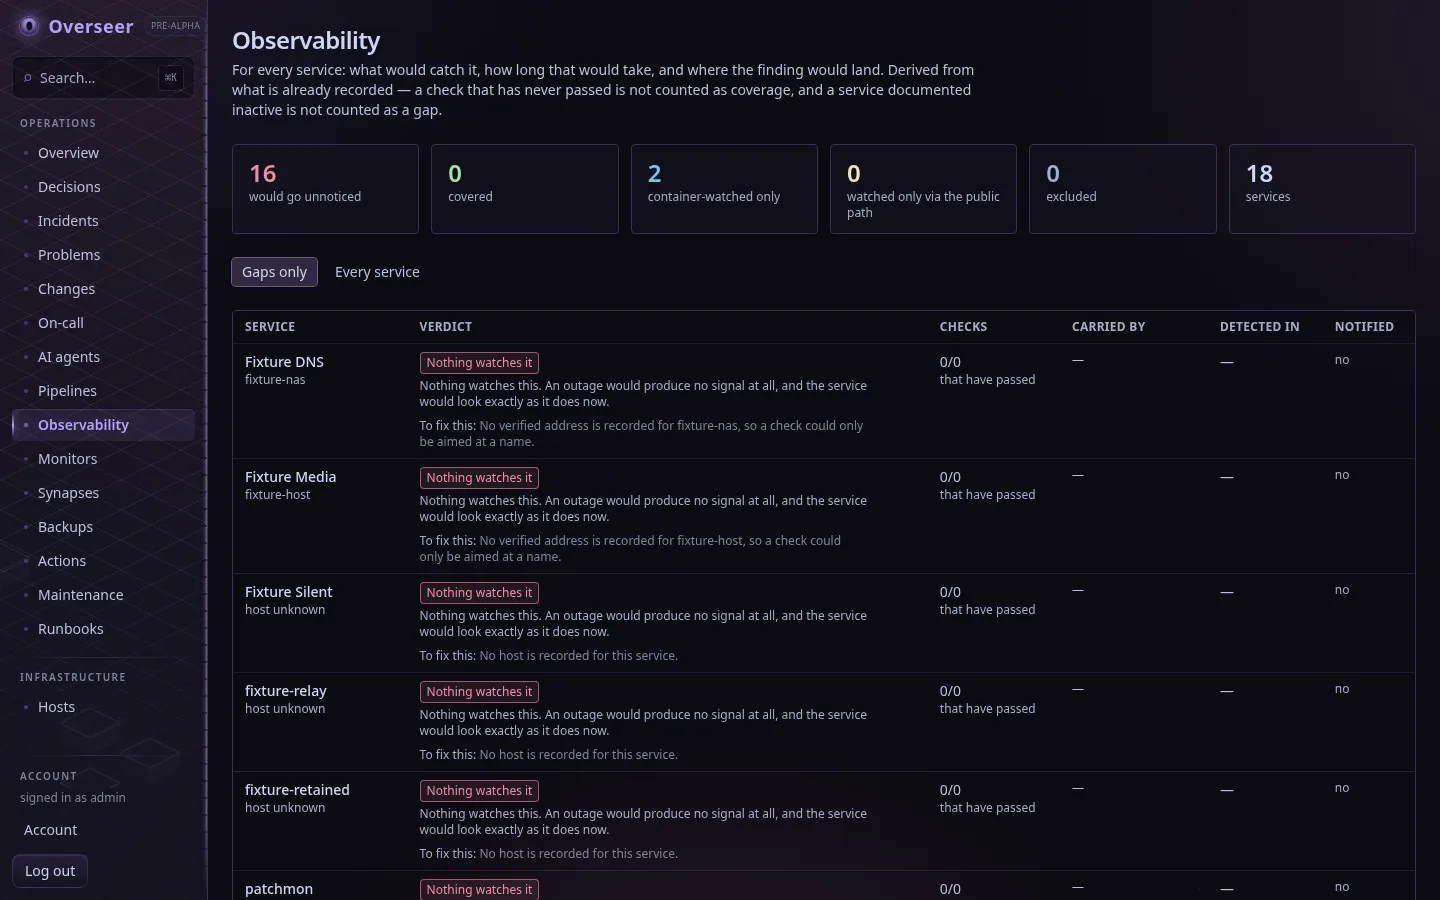
The Observability page answering, per service, whether its death would be detected and delivered.
Per service: would you know if it died, how fast, and would anyone be told — with the command that closes each gap.
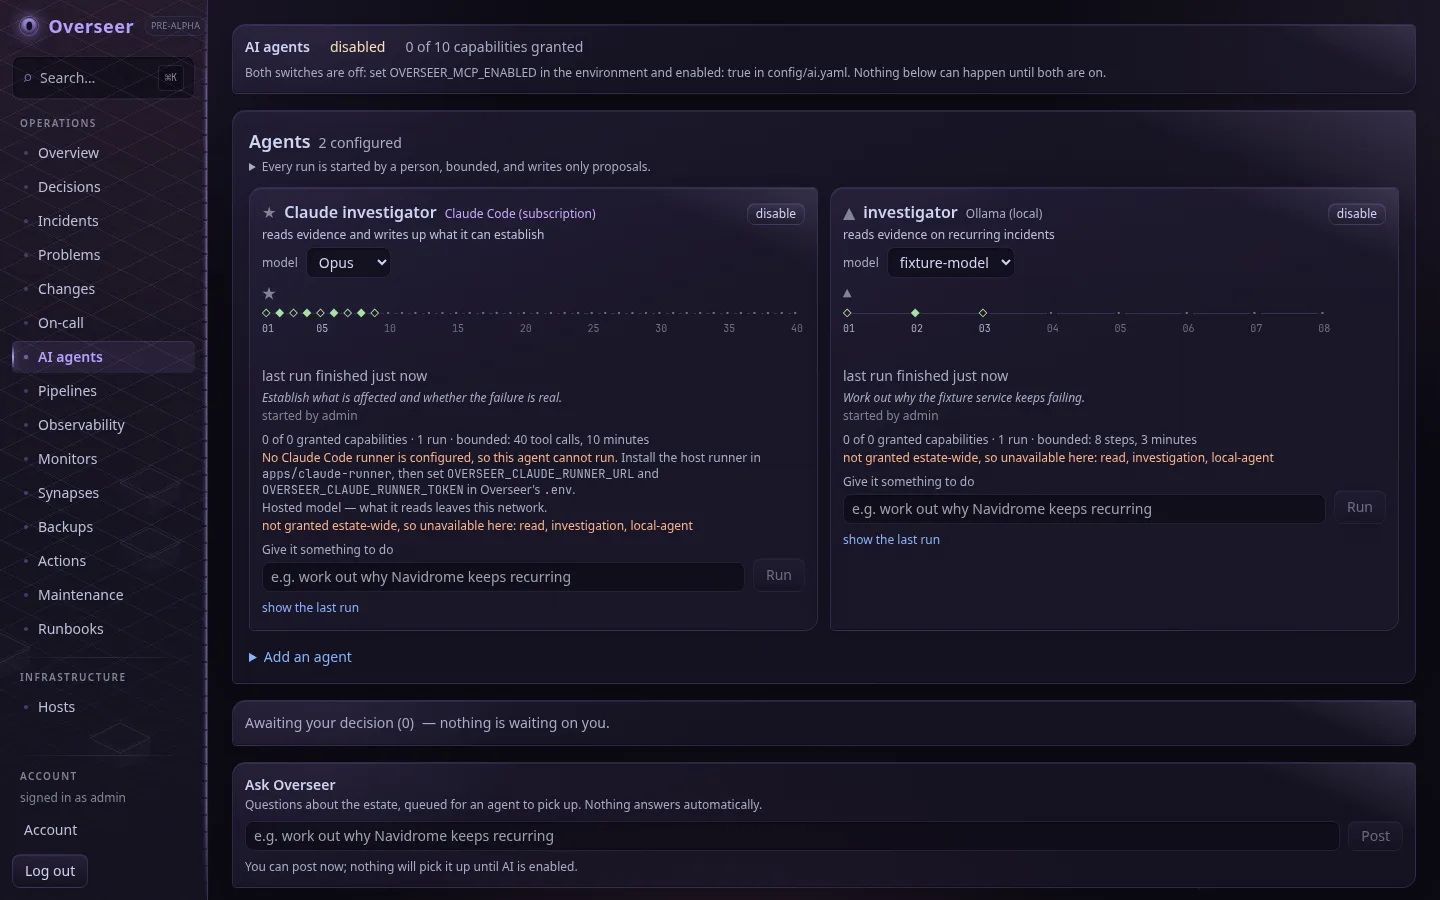
Agents

Put a model on your estate without handing it the controls

Investigating an outage is mostly reading — the queue, the incident, what changed. That is work a model is genuinely good at and nobody enjoys. The industry is racing to let models act; Overseer lets them read, and makes everything they write a draft you approve.

The agents board showing a roster, each agent’s run track, its provider and its bounds.
Agents — the roster, what each one produces, and the steps of the run you are watching.
The agents in full →Off until you switch it on.
What it replaces

Instead of the eight things you are using now

Everybody reading this already has something in each of these slots. This is the swap, stated plainly.

Instead of

A spreadsheet of hosts and services

Inventory collected from what is actually running and reconciled against what you documented. Where the two disagree it says so instead of picking one.

Instead of

A separate uptime monitor

Probe agents you install with one command, reporting where your inventory already lives. They listen on no port and hold no history.

Instead of

A hosted status page

A public page for your customers, built from checks you already have and publishing only the hostnames you list. Planned maintenance shows there while it runs.

Instead of

A pager subscription and a phone tree

An on-call rota with escalation steps, pages that record whether they were delivered, and an Acknowledge that works from the chat message itself.

Instead of

A patching night you keep postponing

Nightly security windows per host, approved once, measured every time, tracked by an incident that closes itself with the delta.

Instead of

A wiki of runbooks nobody opens

Runbooks attached to the incident that needs them, with the reason they were attached recorded.

Instead of

A post-mortem that gets filed and forgotten

A problem record that outlives the incidents that produced it and cannot be marked resolved until a permanent fix is written down.

Instead of

A folder of backup scripts and hope

Policies, copies and restore tests modelled, with a readiness answer derived from evidence rather than from the last job exiting zero.

How it runs

Three facts that decide whether you can host it

01

One container, one file

Docker Compose on a machine you own. State is a SQLite file on your disk; backing it up is copying it.

02

Agents push, nothing pulls

Probe agents pull their assignments and push results outbound. They listen on no port and store no history.

03

Collectors read, and only read

20 connectors gather evidence over SSH, Docker, Prometheus and the rest. None of them writes to your systems.

Fit

Who it is for, and who it is not

If one of the right-hand columns is a dealbreaker, better to find out here than after you have installed it.

Built for

  • Small businesses where IT is one personYou are the help desk, the ops team and the after-hours pager. Overseer detects, files, attributes and investigates on its own, then brings the one decision that needs a human to your phone.
  • Homelabs people depend onIt started as a Pi and became the thing your household’s photos, media and documents live on. Overseer is built and used daily against exactly that estate.
  • MSPs, founders and small teamsYou run infrastructure without a dedicated operations person. Every reading carries the evidence behind it, so “is it covered?” has an answer you can show a client.

Not for you if

  • It is pre-alphaUsed daily against a real estate and covered by an extensive suite, but interfaces still change and there is no upgrade guarantee between versions.
  • It expects you to self-hostNo cloud offering. You run it, you put a proxy in front of it, you keep its backups. That is the trade for your data never leaving your network.
  • It will not run commands for youOperational actions are predeclared, approval-gated and exact-target-only. If you want a tool that can restart anything from a web page, this is not it.
  • It is not a replacement for judgementIt surfaces what needs attention and shows the evidence. It does not decide for you, and it says when it does not know.
Getting started

What it takes to try it

  1. A Linux machine with Docker, and about ten minutes.
  2. Point it at your hosts and services, or let it discover what is running.
  3. Install a probe agent on anything you want watched — one command per machine.
  4. Publish a status page for your customers, if you want one. It is off until you list the hostnames.
git clone https://git.coolhole.net/aestheticjmack/Overseer
cd Overseer
cp .env.example .env      # set the session secret + first admin
docker compose up -d      # migrations apply on start

It binds to localhost. Putting it on a network, and putting a reverse proxy in front of it, is a decision you make deliberately — it is not the default.

Questions

The ones worth asking first

What does it cost?

Nothing. It is AGPL-3.0 open source and there is no paid tier, no hosted plan and no per-host pricing.

Who is actually maintaining this?

One person, in the open. The repository is public, the commit history is the record. There is no SLA — if you need a supported product, this is not one yet.

What happens when it breaks?

You open an issue on the forge, and you keep running. Overseer never sits in the path of anything serving traffic. An Overseer outage costs you visibility, not availability.

Can I get my data out?

It is a SQLite file on your disk. Copy it.

Does it phone home?

No telemetry, no analytics, no account, no licence check. It binds to localhost until you deliberately put it behind something.

I run a five-person company, not a datacentre. Is this overkill?

It is sized for exactly you. One container, one file, ten minutes to install — and then it does the part you do not have headcount for.

What if I outgrow it?

Then you will have spent nothing and can leave with your data. It is not built to become a platform, and it will not pretend otherwise to keep you.