
Per-thread load and clocks from the kernel, core and SoC power, voltage and current from the SVI2 telemetry, per-CCD temperatures, governor and boost.
Self-hosted · Rust · one workstation
Know what the machine is doing
before you tune it.
TEKbench is the telemetry and benchmark tool for my desktop: a Ryzen 9 5950X and a Radeon RX 7900 XTX on a custom water loop. One page shows the CPU, GPU, memory, storage and coolant loop live, keeps 90 days of history, and runs benchmarks that record the tuning they ran under, so a before-and-after comparison means something.
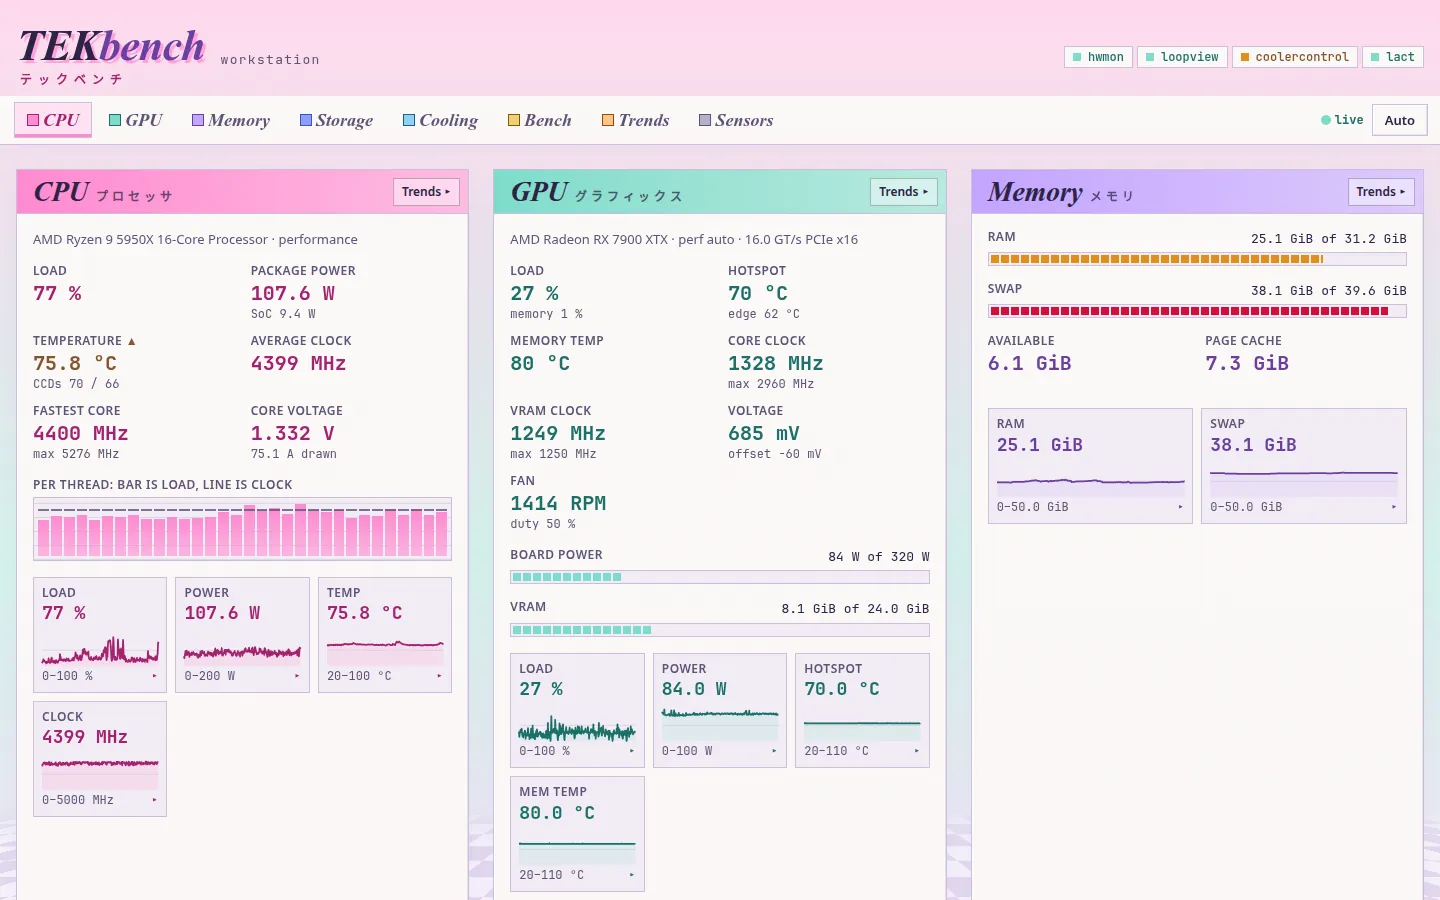
01 · The page
Every section in its own window and colour.
Each window is a Windows 95 frame under a pastel title bar, over a pastel sky and a checker floor. Each section keeps one colour on its window, its tab and every line it charts: CPU rose, GPU teal, memory lilac, storage periwinkle, cooling sky, power apricot. Light and dark follow the system setting, and all motion stops when reduced motion is on.
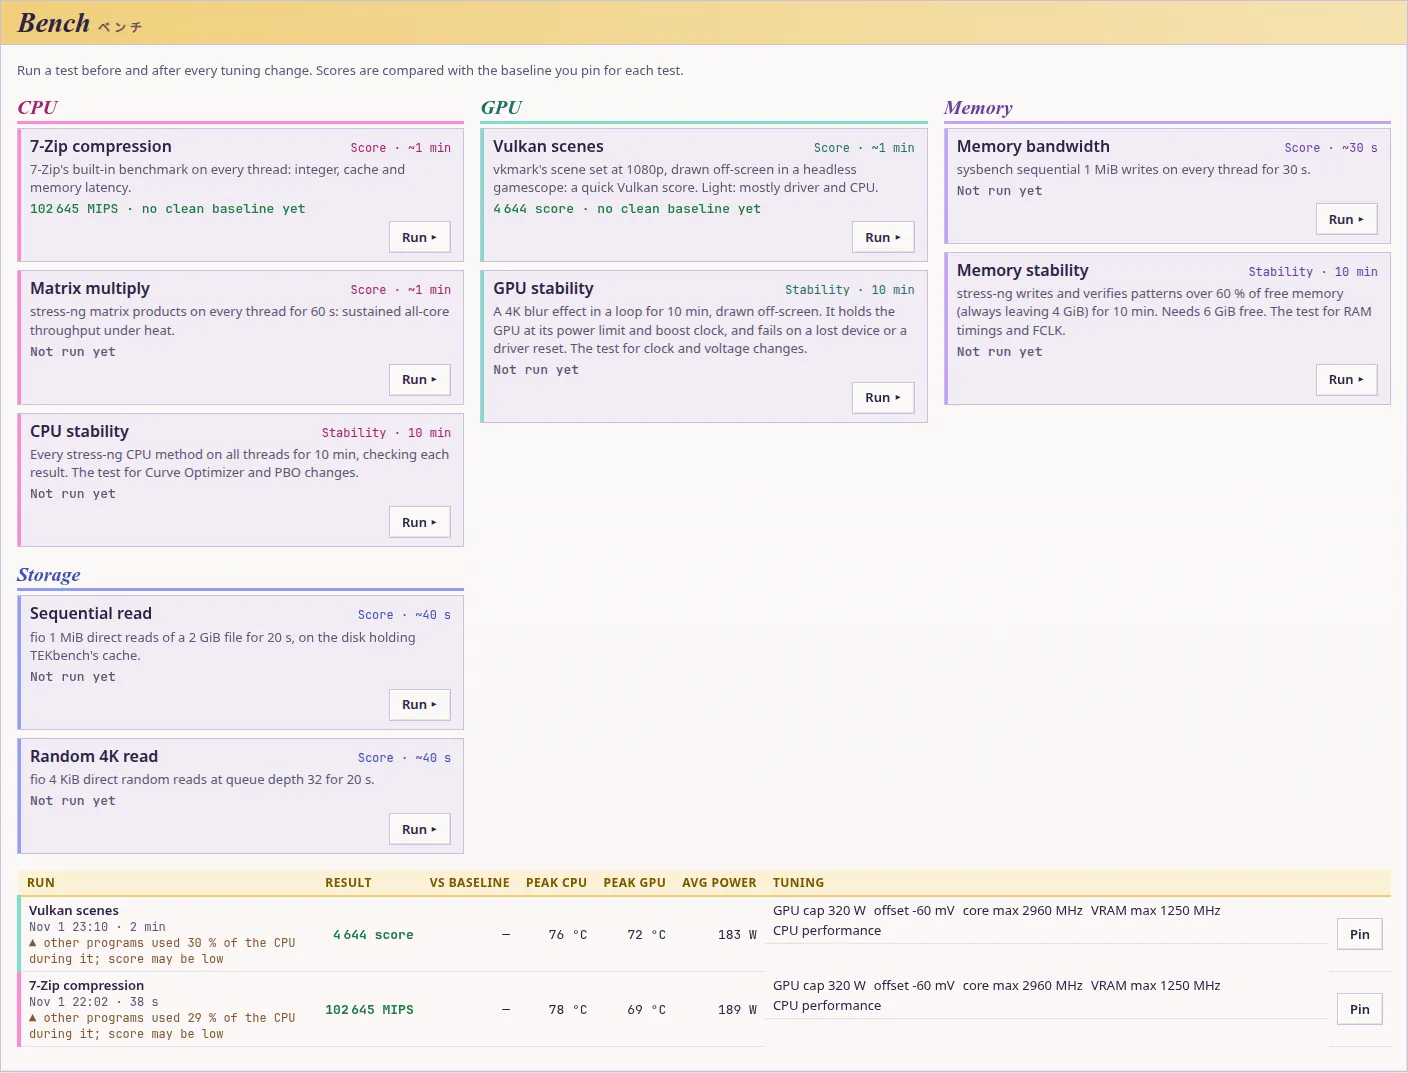
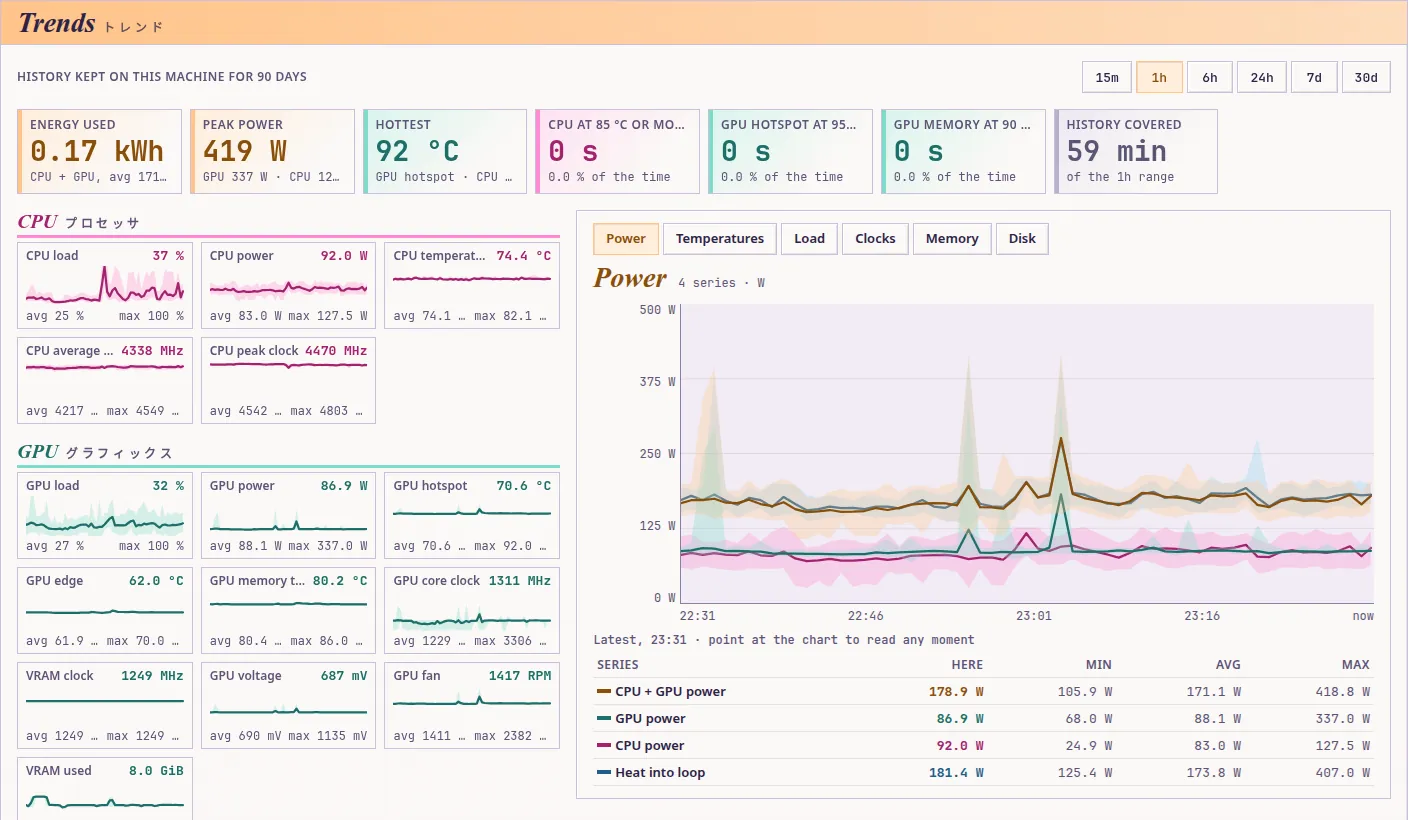
Trends. Pick a range from 15 minutes to 30 days, then a preset (power, temperatures, load, clocks, memory, disk) or any single metric. Point at the focus chart, or touch it, to read every series at that moment beside the range's minimum, average and maximum.
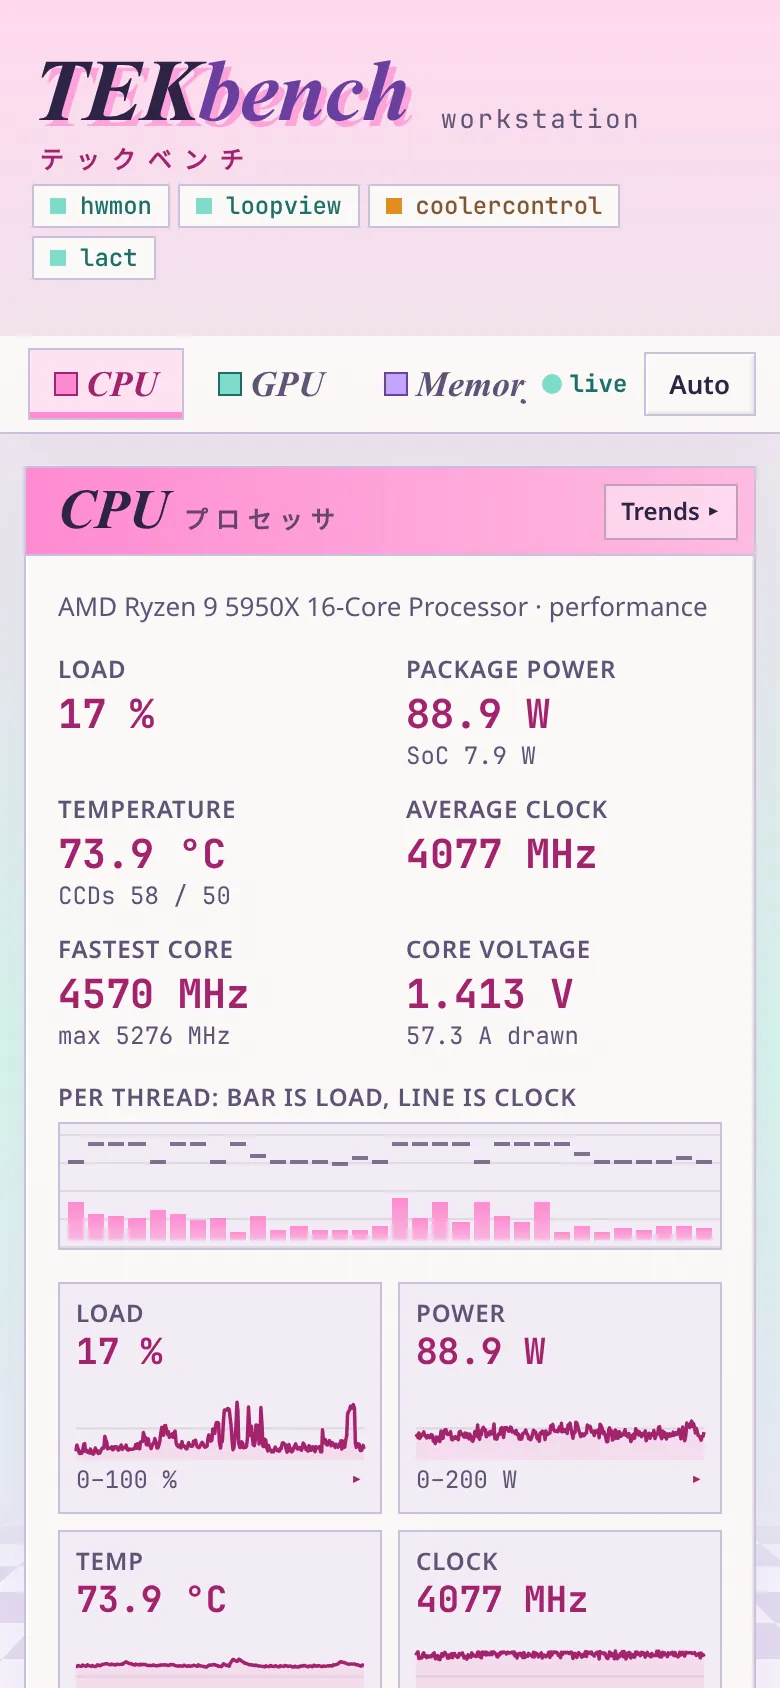
Phones. The page works on a phone on the home network, so I can watch temperatures from across the room during a long run.
Terminal. tekbench-tui shows the same data in a terminal as a client of the running daemon, so it adds no second sampler.
Screenshots are from the running tool on my desktop, with its host name replaced.
02 · What it reads
It reads from the tools that already own the hardware.
TEKbench drives no fans and sets no clocks itself. It reads the kernel and asks the programs that already manage each part, so it never disagrees with them.
The amdgpu driver's load, clocks, power cap, voltage offset, edge, hotspot and memory temperatures, VRAM, fan and PCIe link. The card's name and tuning come from LACT.
RAM, swap and page cache; read and write throughput and busy time per disk; NVMe temperatures.
Coolant in and out, ΔT, flow and heat load from loopview, my coolant-loop monitor, and every fan and pump channel from CoolerControl.
A daemon samples once a second and keeps 15 minutes at full detail for the sparklines, then minute and quarter-hour buckets for 90 days. The web page, the terminal UI and a Prometheus /metrics endpoint all read that one sampler. A /healthz route reports when sampling falls behind.
A reading that is missing shows as —, never as zero. An integration that is down shows as a coloured chip in the header, and the rest of the page keeps working.
- Kernelprocfs, sysfs, hwmon
- GPU tunerLACT, read over its socket
- Fans and pumpCoolerControl
- Coolant looploopview
- Outweb page, terminal, Prometheus
03 · Benchmarks
A score is only useful with its conditions.
Run a test before and after a tuning change and compare against a pinned baseline. Each result records what else was true during the run.
- 7-Zip compression score
- stress-ng matrix multiply
- 10 min stability, every result checked
- vkmark scenes at 1080p
- 10 min 4K stability at the power limit
- Drawn off-screen in headless gamescope
- sysbench bandwidth
- 10 min of verified writes over 60 % of free memory
- fio sequential read
- fio random 4K read
Each result keeps
- the score, or whether the run stayed stable;
- the minimum, mean and maximum of every charted metric during the run;
- the tuning it ran under: GPU power cap, voltage offset and maximum clocks, CPU governor and boost;
- how much CPU other programs used. Above 10 % the result is flagged, and a flagged run is never picked as the baseline.
A run fails when
- the program reports an error;
- vkmark loses the Vulkan device;
- the kernel logs a hardware error during the run: an amdgpu ring timeout or reset, or a machine check.
A stable run with a GPU reset in the kernel log is not a stable overclock.
04 · House rules
The person at the machine comes first.
The desktop is also where I play games. Benchmarks refuse to start while game mode is on, and a running test stops if a game starts. The memory test needs 6 GiB free and always leaves 4 GiB for everything else.
The GPU tests draw inside a headless gamescope session, so nothing appears on screen and no window takes focus.
Everything on the page is a read-only request except starting or cancelling one of the fixed tests and pinning a baseline. Those need a custom header that a browser cannot send from another site, and the daemon checks the host and origin to stop DNS rebinding.
05 · Next
Planned, not built.
- Guided GPU overclocking. Apply a change through LACT, run the stability test, and roll back on its own if the run fails.
- BIOS guidance for the CPU and RAM. Precision Boost Overdrive, Curve Optimizer and memory timings are set in firmware, so TEKbench will give the steps and test the result.
- Reporting to monitoring. Benchmark results and thermal limits shown with the rest of the homelab's service health.
06 · Limits
What it does not do.
It is built for one machine.
Sensor names, the coolant loop and the GPU tuner match my desktop. Other AMD systems may work in part; nothing else has been tested.
It has no login.
It is meant for a trusted home network. Anything that can reach it can read the page and start one of the fixed tests.
A pass is not a guarantee.
Ten minutes of stress finds most unstable settings, not all of them. Games and long renders can still fail where a test passed.
It tunes nothing yet.
Today it measures and compares. Tuning still happens in LACT and the BIOS by hand.
The source is private because it is configured for my own hardware and network.